Temperature Blankets
My partner decided, towards the end of the Christmas holidays, to get obsessed with temperature blankets. Temperature blankets, are blankets that also function as a record of the temperature for a given period. As an example, this blogpost describes a blanket intended to record the temperature for a given year, with each row being a day. The temperature for each day then determines the colour that each particular row will have.Of course, there is nothing stopping you from creating a blanket recording a day, with each row (or set of rows) being an hour.
While there are obvious a lot of considerations to take into account for such a project, I would be completely unaware of them, so I will only discuss the ones that touch upon my interests. No matter what period you are looking to base your blanket on, there are a couple of things you need to figure out.
- What are the temperatures for the given period?
- How will you decide on temperature bands?
- What colours will you use to correspond to each temperature band?
The first thing you need is a reliable list of temperatures. There are ways to get these, but it can be difficult to get them in bulk ( if you need, say 365 days worth of temperatures). I used the Weather Underground API and wrote a script in R to get the temperatures and organise them into a format where I could manipulate the numbers, but that may not be for you.
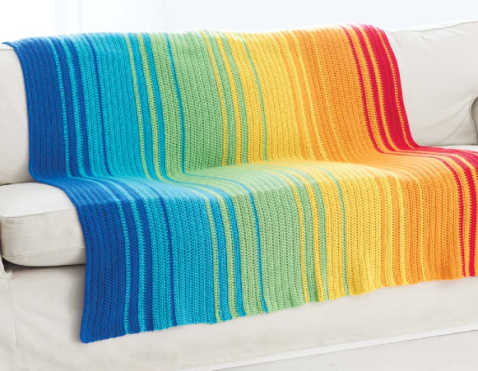
Weather blanket found on The Crochet Crowd.
I did spot a nice app on the Weatherghan site, which not only gives you the temperatures, but also generates a pattern for you based on the temperatures. The problem with this site is that it has preset temperature bands, which means that unless you are from somewhere with a wide range of temperatures (and we are talking American Midwest wide), you will not necessarily end up with that much colour variation in your blanket. In addition, you may not like the colours, or it is difficult to get those particular colours in a type of yarn you enjoy working with and so on.
Because of this, I assume that whoever does a temperature blanked like this have decided on a set of colours they like. There are many ways that you can do this, but most people seem to go with “colder” colours like blues on one end and “warmer colours” like yellows and reds on the other.
Once you have decided on the colours you want, you need to determine the range of bands and the colours to go in them. The most straightforward way of doing this is to take number of different colors that you have and divide it by the range of temperatures that exist for that period. The range can be arrived at by subtracting the low tempereture from the high temperature.
Imagine you have the following (the temperatures are from Hatfield, Hertfordshire, and the period is the year that our son was born):
- 7 colours of Yarn
- High Temperature of 24 degrees
- Low temperature of -2 degrees
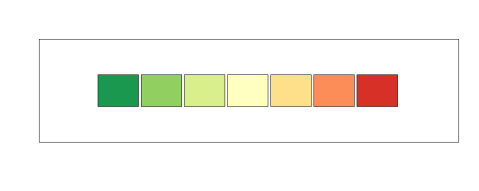
The 7 different colors that I have
The range is 24- (-2) which is 26 degrees. Divided by 7, we get that each band correspond to 3.7. This is not exactly ideal, so we can pad it out to -3 to 25 which gives us a range of 28 degrees (which gives us each band being 4 degrees wide).
The first band will then consists of the temperatures between -3 and 1, the second will consist of 2 to 5, the third of 6 to 9 and so on.
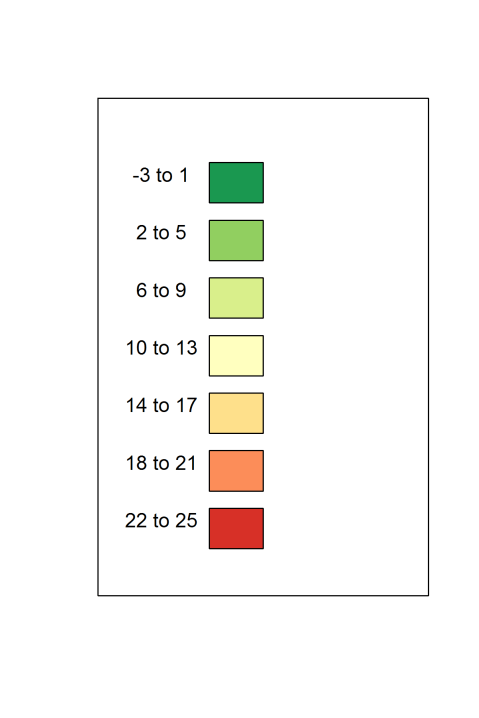
Temperature Bands with colors.
While this is a good start, and it does show us all the colors that will be in the blanket, it doesn’t really tell us what our blanket will look like in the end. To do this, we need to look at the spread of temperatures.
One way of doing this is to use percentiles. In everyday life, the only time I come into contact with the concept of percentiles is whenever my son gets measured for something or other, such as height, weight, reading ability etc. Basically they tell us what percentage of all observations lie below a specific observation. For instance, my son was really thin in his first year, and consistently lay around the 10th percentile for his height. This meant that only 10 percent (or one in 10) of children his height would weigh less than him. However, while short, he wasn’t that short, and so was normally around the 20th percentile for his height, which meant that only 20 percent (or one in five) of all children his age would be shorter than him. The converse was true as well, so 80 percent of children his age would be taller, and 90 percent of children would weigh more.
Returning to our particular set of temperatures we have the following percentiles:
- 0 percentiles (or lowest score): -2
- 25th percentile: 6
- 50th percenitle: 10
- 75th Percentile: 14
- 100 percentile(or highest score): 24
The range between the 25th and the 75th percentile is sometimes called the interquartile range(because it goes between the lowest and the highest quarter), and represents the middle half of observations. Basically, half of your blanket will be whatever colours correspond to the range between these values. In my case that would be between 6 and 14 degrees.
So half of my blanket will consist of these colours, which is not very exciting:
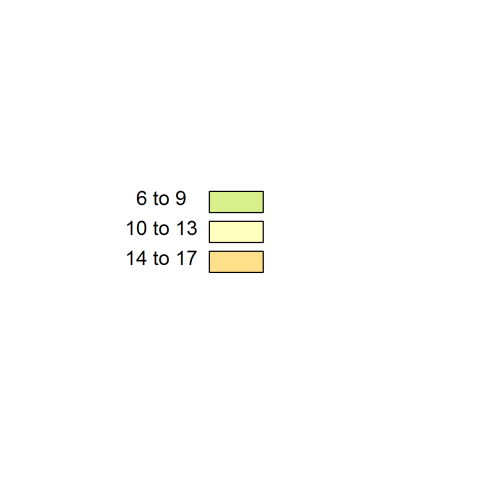
At least half of the time.
In fact, if we were to use percentiles to see how much we would use of each colour, the numbers would be a bit like this:
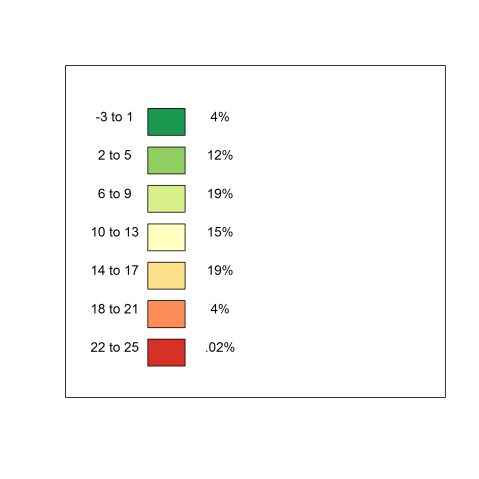
Approximate percentage of use for each colour.
Here we see that our nice dark red would only see use less than once every 200 days! Also, it means that we would have to watch how much yarn we are to buy of each colour, as we we would use far more yarn of the middle colour than those towards the edges. What should we do?
Well, one solution is to use percentiles instead. This way, instead of using bands defined by a set number of degrees we use bands defined by the percent of days. The first band will be the 10% of days with the lowest temperature, the next band will be between 10 and 20 percent, and so on. To do this we will use 8 colours (because it is easier to work with than 7).
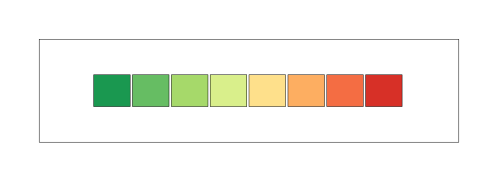
8 Color Palette
Now that we have decided on this, we can then move on to deciding whether or not each should get an equal share or whether or not there should be differences. I was in favour of having equal shares, which means that each color could be seen one-eights (or 12.5%) of the time, this would give us a palette like this.
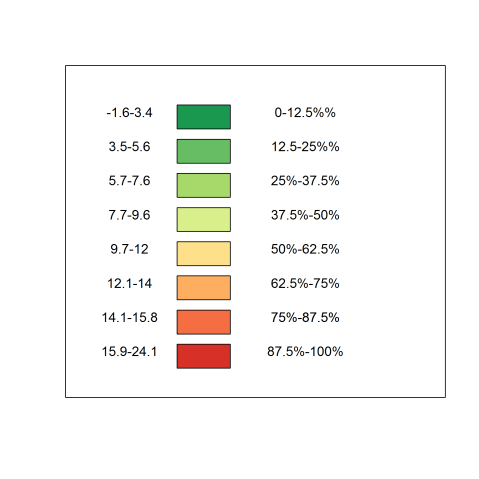
Equalised Range
I showed the above graph, proudly to my partner, who immediately disagreed with this approach. She did not want a homogenous approach, but was happy with having rare colours being used for the most extreme temperatures. She suggested that after you have determined the where the percentiles lie, you can decide on colours you find aesthetically pleasing for the middle range, for instance to match the colours of the room that you intend the blanket to be in. However to do this, it is a very good idea to assess where the percentiles lie, so that you know before hand what colours you will see most often.
If you have a list of the temperatures for a given period and access to Microsoft Excel, finding the percentiles is fairly straightforward, by using the (aptly named) PERCENTILE function, you type in PERCENTILE followed by the range of temperatures and the percentile you are interested in. So for instance, if you had the temperature data in the cells A1:A366, you could replicate my approach using the following Excel Commands
=PERCENTILE(A1:A366,.125)
=PERCENTILE(A1:A366,.25)
=PERCENTILE(A1:A366,.375)
=PERCENTILE(A1:A366,.50)
…and so on. You can go to Excel Easy for a more detailed explanation of how excel generates percentiles for you.
Chi-Square in Google Docs
Here is a spreadsheets which demonstrates how to perform a crosstabulation analysis with a chi-square test in Google Sheets. Google Sheets does for some reason not have a function to arrive at a p-value for chi-square distributions, but since we can arrive at an F-value by dividing the Chi-square value with the degrees of freedom, we can do just that.
Thank you to my colleague Neil Spencer for pointing me in the right direction for this solution, and to Aris Alissandrakis for giving me an excuse to try it out. Any mistakes are of course, mine, and cannot be blamed on either of these two.
The example below shows how this can be practically implemented using Google Sheets:
For an explanation of the relationship between the distributions, see the following (external link):
The Robotic Metamorphosis of Gregor Samsa
According to Nature Future Conditional, a Japanese theatre is setting up a stage version of Kafka’s Metamorphosis. In this particular version of the play, the protagonists does not transform into an insect, but rather finds himself in the body of one of Hiroshi Ishiguro’s Androids. I think this is a brilliant idea. I think that the use of a robotic body to signify the alien self that Gregor finds himself in is really interesting. One of the most common proposed uses of Ishiguro’s is as ways for us to extend our presence into environments that we are unable or unwilling to be in. Already, robotic systems are marketed to doctors and other health-professionals allowing them to interact with their patients. In Europe, the Giraffe robot is a good example. This robot is marketed on the company website as allowing the carer to …”make short visits in between other appointments just to “check in” and spend some social time instead of always rushing to complete in-home tasks…Maybe even make the difference in that person being able to live independently”. If anything, the company meets any potential criticisms of technology dehumanising relationships straight on, by making sure that the human added value to using the robot is brought home to the customer.
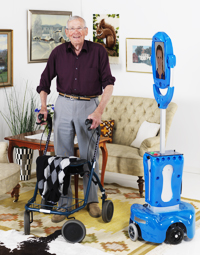
Doing a house call from home with a Giraffe.
Still it makes me think of the movie Surrogates, where Bruce Willis deals with a world in which nobody goes outside, instead sending their robotic avatars to face the world. It even has one of Ishiguro’s androids in the title sequence. One of the frontiers of telepresence in that movie is that of robotic avatars for children. It seems that in the telepresent future, children are still children.
Bruce Willis finds himself in a similar conundrum in the movie Surrogates.
The year after Surrogates was released, however, the following paper was presented at the 19th IEEE International Symposium in Robot and Human Interactive Communication (Ro-man 2010): “Telerobotics connecting classrooms between Japan and US: a project overview.” by Tanaka Fumihide and Tomoyuki Noda. This paper outlines the work that the authors did using telepresence robots to allow Japanese primary school pupils to interact with children and teachers in an American school. This is intended to allow for greater language immersion and so facilitate the acquisition of the foreign language and the ability to move in the same space as those one interact with seems to make interactions more engaging.. The later work by this group has shown that the use of telepresence robots have some benefits. While you may feel alienated from your telepresent robotic body, it is still less alienating than only being present as a disembodied voice, or an image on a still screen.
Welcome to Night Vale
Today I had a look at website called Welcome To Night Vale. It is a bi-monthly podcast which takes the form of local radio newscasts in the fictional American town of Nightvale. It is possibly the best podcast I have ever listened to. There is nothing like listening to a slightly bored American reading out news in which the local public library’s Summer Reading program is exposing the local children to unspeakable horrors, necessitating the decapitation of local librarians, or how the local subway system is actually a transdimensional gateway operated by gestalt-entities made up of cockroachswarms in business suits wearing deermasks.
Worth a look.
The buddha-natu…
The buddha-nature has no physical form and is not
confined to one part of the body. It fills the whole
and all the parts. The hands, the feet, every single
hair contains the buddha-nature. Furthermore, the
buddha-nature is present in the earth and in that
which grows upon it. It is present in the wind and
in the sea. It inhabits that which feels and that
which does not feel; it is present in delusion as in
enlightenment. Everything that exists is made of
the buddha-nature. … The buddha-nature, then, is
the principle or law that moves everything. … It is
impossible for us to get outside the buddha-nature.
Masahiro Mori – The Buddha in the Robot

Recent Comments